Authors
José Manuel Mansilla-Fernández[1]Public University of Navarre and Institute for Advanced Research in Business and Economics (INARBE).
Incidence of the Covid-19 in Europe
Figure 1: The Covid-19 pandemic exploded in Europe in March 2020; a second wave started in Fall, with more heterogeneous effects across countries. Lockdowns and social distancing measures had a strong negative impact on the economy.

Source: Own elaboration based on data from Refinitiv Eikon. Data are presented as a 5-day moving average to smooth variations in recording daily deaths.
Figure 2: The Great lockdown in Europe (2020Q1 and 2002Q2) diminished production substantially, although economic recovery began in the second half of the year (2020Q3 and 2020Q4).

Figure 2: The Great lockdown in Europe (2020Q1 and 2002Q2) diminished production substantially, although economic recovery began in the second half of the year (2020Q3 and 2020Q4).
The impact of the Covid-19 crisis on the banking sector
Figure 3: Investors perceived banks as comparatively safer institutions during the Covid-19 crisis than during the sovereign debt crisis. The European Central Bank’s pandemic programmes supported more favourable financing conditions.

Source: Own elaboration based on data from Refinitiv Eikon. The lines represent the daily difference between 5-year Banks’ CDS and 10-year Sovereign Bonds CDS.
Figure 4. European banks slightly improved their capitalization during the Covid-19 crisis.

Source: Own elaboration based on ECB data. The Tier 1 capital ratio is defined as the proportion of tier 1 capital – equity capital and disclosed reserves – to total risk-weighted assets.Interruzione pagina
Figure 5. The dispersion of Tier 1 capital across banks increased during the Covid-19 crisis, and more in some countries than in others.


Source: Own elaboration based on the EBA database. The Tier 1 capital ratio is defined as the proportion of tier 1 capital – equity capital and disclosed reserves – to total risk-weighted assets. The whiskers represent the maximum and the minimum of the distribution. The box is divided into two parts by the median. The upper (lower) box represents the 25 percent of the sample greater (lower) than the median up to the third quartile and down to the first quartile). The mean of the distribution is represented by ×.
Figure 6. Banks slightly increased the share of domestic sovereign bonds held in their balance sheets, the more so in periphery countries.

Source: ECB. Ratio of the holdings of domestic sovereign debt and total assets by MFIs in each country. Core countries are Austria, Belgium, Finland, France, Germany, and the Netherlands; periphery countries are Greece, Ireland, Italy, Portugal, and Spain (see the Numbers note in the European Economy 2016.1 issue).
Figure 7: Bank lending increased on average in the Euro zone, but at different rates across countries.

Source: Own elaboration based on ECB data. Figures are year-on-year percentage changes of the stock of banks loans.
Figure 8. The ratio of non-performing loans (NPLs) to total loans reduced slightly during the pandemic.

Source: Own elaboration based on ECB data. This ratio is calculated as the volume of impaired loans to total loans by country.
Figure 9. The share of loans under forbearance, and its evolution during the pandemic, are heterogeneous across European countries.

Source: EBA Risk Dashboard. The forbearance ratio is calculated as exposures with forbearance measures to total gross loans and advances. Forbearance denotes a situation where a lending contract or other bilateral credit relationship has become problematic (in the sense of unexpectedly deviating from contractual cash flows due to the actions of one counterparty) leading to lender granting concessions or modifications that it would otherwise not consider.
Moratoria and Public Credit Guarantee Schemes (PGS)
Figure 10. In some European countries, contingent liabilities related to the government guarantees offered on bank loans are a relevant share of new loans.

Source: EBA supervisory reporting.
Figure 11. Loans under moratoria is comparatively higher in the so-called periphery countries than in core countries.
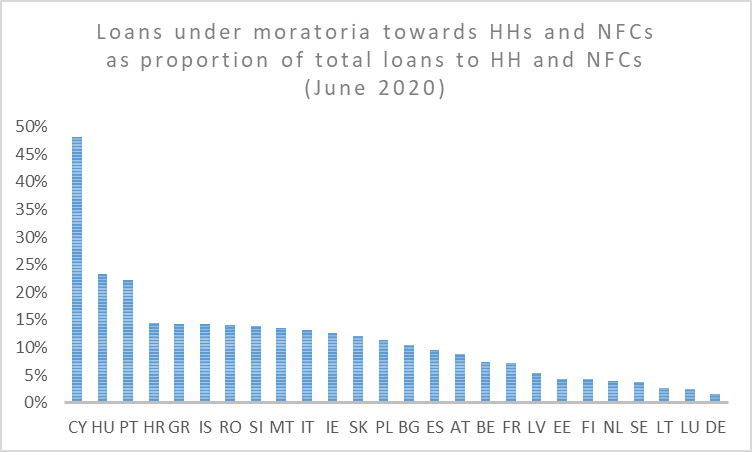
Source: EBA supervisory reporting.
Figure 12. The share of loans under moratoria which are classified as Stage 2 is heterogeneous across European countries, and it is higher than the average share of loans classified as Stage 2 in the country.

Source: EBA supervisory reporting; data refer to 2020Q2. According to the International Financial Reporting Standard (IFRS) 9, a loan should be classified as stage 2 when its credit risk has increase significantly, and the payment past due by 30 days (underperforming). Countries included in the sample are: Austria (AT), Belgium (BG), Bulgaria (BG), Cyprus (CY), Denmark (DK), Estonia (EE), Spain (ES), Finland (FI), France (FR), Greece (GR), Croatia (HR), Hungary (HU), Ireland (IE), Iceland (IS), Italy (IT), Lithuania (LT), Luxembourg (LU), Latvia (LV), Malta (MT), The Netherlands (NL), Poland (PL), Portugal (PT), Romania (RO), Sweden (SE), Slovenia (SI), and Slovakia (SK).
Figure 13. European banks increased their holdings of cash and central bank reserves, partly as a result of central bank funding.


Source: EBA supervisory reporting.
Figure 14: Bank deposits increased in all European countries.

Source: Own elaboration based on ECB data.
Figure 15. Bank profitability generally decreased in all major European countries during the Covid-19 pandemic crisis.

Source: Own elaboration based on ECB data. The return on equity ratio is calculates as the annualized operating profits before taxes over total equity and represents banks’ profitability. Data are adjusted for seasonality.
Stylised facts on moratoria and public guarantee schemes (PGS)
Figure 16. NPL ratios are larger for countries with higher level of loans subject to moratoria.

Source: Own elaboration based on the EBA database; data refer to 2020Q4. NPL ratio is calculated as the value of amount of non-performing loans to that of total loans. Countries included in the sample are: Austria (AT), Belgium (BG), Bulgaria (BG), Denmark (DK), Estonia (EE), Spain (ES), Finland (FI), France (FR), Croatia (HR), Ireland (IE), Iceland (IS), Italy (IT), Lithuania (LT), Luxembourg (LU), Latvia (LV), Malta (MT), The Netherlands (NL), Poland (PL), Romania (RO), Sweden (SE), Slovenia (SI), and Slovakia (SK).
Figure 17. Debt-to-GDP ratios are higher in countries with a larger share of loans subject to moratoria.

Source: Own elaboration based on the EBA database; data refer to 2020Q4. Countries included in the sample are: Austria (AT), Belgium (BG), Bulgaria (BG), Cyprus (CY), Denmark (DK), Estonia (EE), Spain (ES), Finland (FI), France (FR), Greece (GR), Croatia (HR), Hungary (HU), Ireland (IE), Iceland (IS), Italy (IT), Lithuania (LT), Luxembourg (LU), Latvia (LV), Malta (MT), The Netherlands (NL), Poland (PL), Portugal (PT), Romania (RO), Sweden (SE), Slovenia (SI), and Slovakia (SK).
Figure 18. The Tier 1 capital ratio is found to be lower in countries with higher level of loans subject to moratoria.

Source: Own elaboration based on the EBA database; data refer to 2020Q4. Countries included in the sample are: Austria (AT), Belgium (BG), Bulgaria (BG), Cyprus (CY), Denmark (DK), Estonia (EE), Spain (ES), Finland (FI), France (FR), Greece (GR), Croatia (HR), Hungary (HU), Ireland (IE), Iceland (IS), Italy (IT), Lithuania (LT), Luxembourg (LU), Latvia (LV), Malta (MT), The Netherlands (NL), Poland (PL), Portugal (PT), Romania (RO), Sweden (SE), Slovenia (SI), and Slovakia (SK).
Figure 19. Higher loans with moratoria ratios are associated with lower returns on equity (ROE).

Source: Own elaboration based on the EBA database; data refer to 2020Q4. ROE is the return on equity ratio, which is calculated as operating profits over equity. Countries included in the sample are: Austria (AT), Belgium (BG), Bulgaria (BG), Cyprus (CY), Denmark (DK), Estonia (EE), Spain (ES), Finland (FI), France (FR), Greece (GR), Croatia (HR), Hungary (HU), Ireland (IE), Iceland (IS), Italy (IT), Lithuania (LT), Luxembourg (LU), Latvia (LV), Malta (MT), The Netherlands (NL), Poland (PL), Portugal (PT), Romania (RO), Sweden (SE), Slovenia (SI), and Slovakia (SK).
Figure 20. The higher the Tier 1 ratio, the lower new loans under public guarantee schemes (PGS).

Source: Own elaboration based on the EBA database; data refer to 2020Q2. The vertical axis represents newly originated loans under PGS. The Tier 1 capital ratio is defined as the proportion of tier 1 capital -equity capital and disclosed reserves- to total risk-weighted assets. Countries included in the whole sample are: Austria (AT), Belgium (BG), Bulgaria (BG), Cyprus (CY), Denmark (DK), Estonia (EE), Spain (ES), Finland (FI), France (FR), Greece (GR), Croatia (HR), Hungary (HU), Ireland (IE), Iceland (IS), Italy (IT), Lithuania (LT), Luxembourg (LU), Latvia (LV), Malta (MT), The Netherlands (NL), Poland (PL), Portugal (PT), Romania (RO), Sweden (SE), Slovenia (SI), and Slovakia (SK).
Figure 21. The higher the Tier 1 ratio, the lower the non-performing loans (NPLs) ratio.

Source: Own elaboration based on the EBA 2020 EU-wide transparency exercise data, which refer to 2020Q2. The horizontal axis represents the Tier 1 capital ratio, which is defined as the proportion of tier 1 capital -equity capital and disclosed reserves- to total risk-weighted assets. The vertical axis shows the non-performing loans (NPLs) ratio, which is calculated as impaired loans over total loans. The slope of the regression is statistically significant (p-value < 0.011). The sample includes individual observations of banks from Austria, Belgium, Denmark, Estonia, Finland, France, Germany, Hungary, Iceland, Ireland, Italy, Latvia, Lithuania, Luxembourg, Malta, Netherlands, Norway, Poland, Portugal, Romania, Slovenia, Spain, Sweden, and the United Kingdom.
Footnotes
| ↑1 | Public University of Navarre and Institute for Advanced Research in Business and Economics (INARBE). |
|---|