Authors
José Manuel Mansilla-Fernández[1]Public University of Navarre (UPNA) and Institute for Advanced Research in Business and Economics (INARBE).
Characteristics of Open Banking[2]We wish to thank Platformable for making their data available for our research.
Figure 1. APIs development by banks.
Notes: Own elaboration on Platformable and world Bank data. The figure reports the first 30 countries ordered by the ratio of the number of APIs developed by banks in the Platformable sample and the total number of banks in the country.
Figure 2a. APIs development by banks in different world regions.
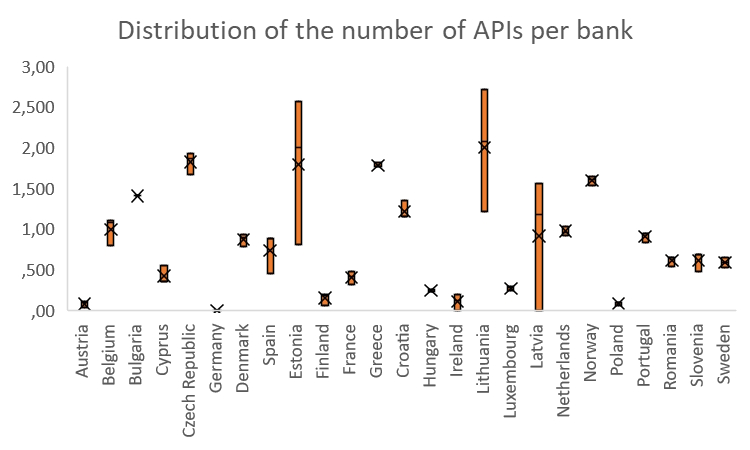
Figure 2b. APIs development by banks in Europe.
Notes: Own elaboration on Platformable database. The vertical axis represents the average number of APIs developed by each bank of the sample. The whiskers represent the maximum and the minimum of the distribution. The box is divided into two parts by the median, i.e., the 50 percent of the distribution. The upper (lower) box represents the 25 percent of the sample greater (lower) than the median, i.e., the upper (lower) quartile. The mean of the distribution is represented by ×.
Figure 3: APIs development and bank size.
Notes: Own elaboration on Platformable database. Correlation between banks’ size measured as the natural logarithm of bank’s i total assets (Ln(Total assets)) in 2022Q3, which is represented in the horizontal axis, and the number of APIs in 2022Q3, which is represented in the vertical axis. The sample includes banks from Austria, Denmark, France, Greece, Ireland, Italy, The Netherlands, Spain, and the United Kingdom.
On FinTech companies
Figure 4: Use of FinTech-provided services.
Notes: Own elaboration on Platformable database. The vertical axis represents the different FinTech categories by functions. The horizontal axis represents the share of the number of FinTech companies included in Platformable by category. The sample includes FinTech companies from Europe, The United Kingdom, and the United States.
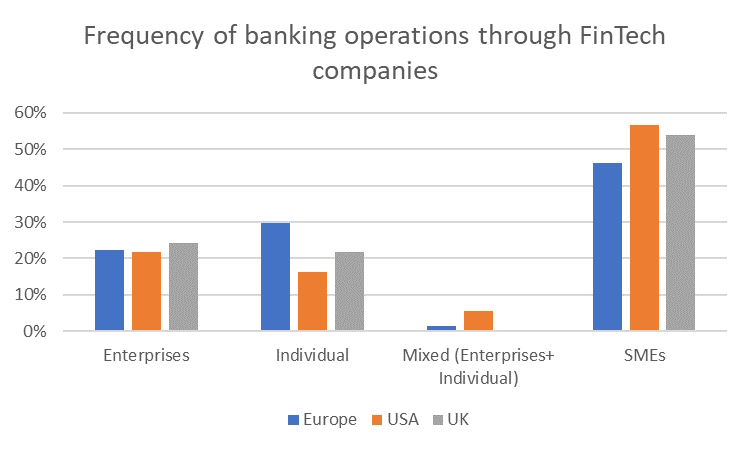
Figure 5: Users of FinTech-provided services.
Notes: Own elaboration on Platformable database. The horizontal axis represents different users of banking services provided by FinTech companies. The vertical axis the share of each users. The sample includes FinTech companies from Europe, The United Kingdom, and the United States.


