A sector-based classification approach
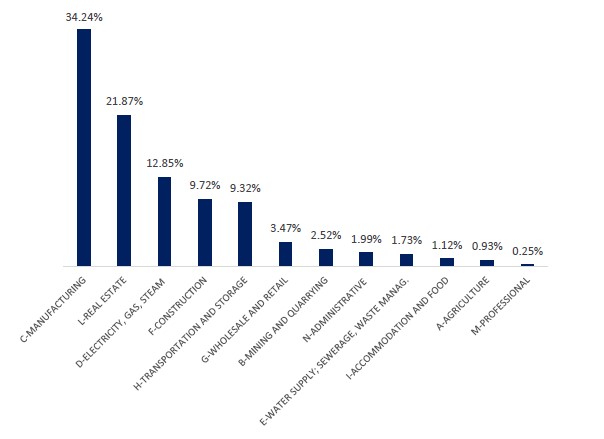
Figure 1. European banks’ exposure towards climate-policy-relevant sectors.
Notes: Own elaboration based on the classification of climate-policy-relevant sectors (CPRS) proposed by Battiston et al. (2017)[1]Battiston, S., Mandel, A., Monasterolo, Schütze, F and Visentin, G. (2017). A climate stress-test of the financial system. Nature Climate Change 7: 283-288. DOI: https://doi.org/10.1038/nclimate3255 applied to EU banks’ exposures provided by EBA. The CPRS consists of 8 categories, with different incidence in each sector: 1. Fossil fuel, 2. Utility, 3. Energy-intensive, 4. Buildings, 5. Transportation, 6. Agriculture, 7. Finance and 8. Others. Exposures to categories 1 to 6 are defined as those that may be affected by climate transition risks. The total value of expositions is of 2,346.53 billion of euros.
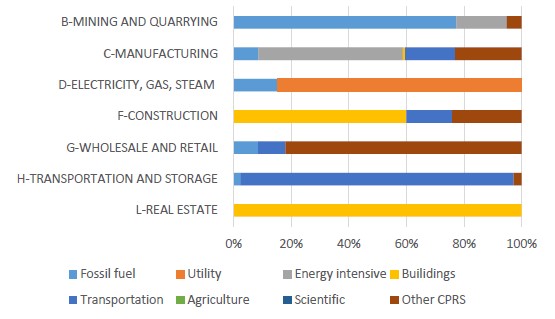
Figure 2: European banks’ exposure towards climate-policy-relevant sectors by category of climate transition risk.
Notes: Based on the classification of climate-policy-relevant sectors (CPRS) proposed by Battiston et al. (2017)[2]Battiston, S., Mandel, A., Monasterolo, Schütze, F and Visentin, G. (2017). A climate stress-test of the financial system. Nature Climate Change 7: 283-288. DOI: https://doi.org/10.1038/nclimate3255 applied to EU banks’ exposures provided by EBA. The CPRS consists of 8 categories, with different incidence in each sector: 1. Fossil fuel, 2. Utility, 3. Energy-intensive, 4. Buildings, 5. Transportation, 6. Agriculture, 7. Finance and 8. Others. Exposures to categories 1 to 6 are defined as those that may be affected by climate transition risks. The total value of expositions is of 2,346.53 billion of euros.
A greenhouse gas (GHG) emission-based classification approach
Figure 3: European banks’ exposure according to greenhouse gas emission intensity
Notes: Based on EBA. Greenhouse emission intensity buckets applied to EU banks’ exposures provided by EBA. Buckets are defined based on percentiles of the distribution of greenhouse gas, produced by Trucost (S&P Global) https://www.trucost.com (see the table below). The total value of expositions is of 2,346.53 billion of euros.
Figure 4: European banks’ exposure according to greenhouse gas emission intensity and sector.
Notes: Based on EBA.
A scenario analysis
Figure 5: GDP evolution under different climate scenarios.
Notes: Based on the EBA. The two scenarios represent the difference with respect to orderly transition, and they are built using the parameters sourced from the new ECB climate risk stress test framework, which includes the impact of both the transition and physical risks. The ‘disorderly’ scenario is associated with relatively high costs from a delayed/ineffective transition, and the ‘hot house world’ scenario is when no polices are implemented and natural catastrophes might occur.
Figure 6: Changes in firm-level probability of default with respect to the orderly transition scenario (2020 to 2050).
Notes: Based on EBA. Full bars represent the average increase in the probability of default across firms; dotted bars the increase for firms that are more vulnerable to physical risk. The two scenarios represent the difference with respect to orderly transition, and they are built using the parameters sourced from the new ECB climate risk stress test framework, which includes the impact of both the transition and physical risks. The ‘disorderly’ scenario is associated with relatively high costs from a delayed/ineffective transition, and the ‘hot house world’ scenario is when no polices are implemented and natural catastrophes might occur.
Figure 7: Green asset ratio.
Notes: Based on the EBA. The green asset ratio is constructed for each bank by dividing the green exposure – available only for a subset of exposures – by the total original exposure. The green amount is constructed using either bank’s self-reported data or TAC estimates.
Footnotes
| ↑1, ↑2 | Battiston, S., Mandel, A., Monasterolo, Schütze, F and Visentin, G. (2017). A climate stress-test of the financial system. Nature Climate Change 7: 283-288. DOI: https://doi.org/10.1038/nclimate3255 |
|---|


