The role of SMEs in European economies
Figure 1

Source: European Commission, Annual Report on European SMEs. According to the EU recommendation 2003/361, firms with less than 250 employees and an annual turnover not exceeding 50 million € (or a balance sheet total not exceeding 43 million €) are classified as SMEs?
Figure 2
Source: European Commission, Annual Report on European SMEs. Other services include Electricity, gas, steam and air condition supply; Water supply, sewerage, waste management and remediation activities; Wholesale and retail trade, repair of motor vehicles and motorcycle; Transportation and storage; Information and communication; Real estate activities; Professional, scientific and technical activities; Administrative and support services. Sectors are classified according to Nace Rev. 2.
Figure 3
Source: European Commission, Annual Report on European SMEs. Other services include Electricity, gas, steam and air condition supply; Water supply, sewerage, waste management and remediation activities; Wholesale and retail trade, repair of motor vehicles and motorcycle; Transportation and storage; Information and communication; Real estate activities; Professional, scientific and technical activities; Administrative and support services. Sectors are classified according to Nace Rev. 2.
The importance of Small Business Lending for Banks
Figure 4
Source: ECB Statistical Data Warehouse. New loans to SMEs are defined as loans to non-financial corporations, new business, of value up to and including 1 million €. New loans to large firms are defined as loans to nonfinancial corporations, new business, of value over 1 million €.
Figure 5
Source: ECB Statistical Data Warehouse. New loans to SMEs are defined as loans to non-financial corporations, new business, of value up to and including 1 million €. New loans to large firms are defined as loans to nonfinancial corporations, new business, of value over 1 million €.
Figure 6
Source: ECB Statistical Data Warehouse. 12-month moving average of the value of new loans to SMEs (new business, of value up to and including 1 million €) to total new loans to non-financial corporations.
Figure 7
Source: ECB Statistical Data Warehouse. Interest rates on loans up to and including 1 million €.
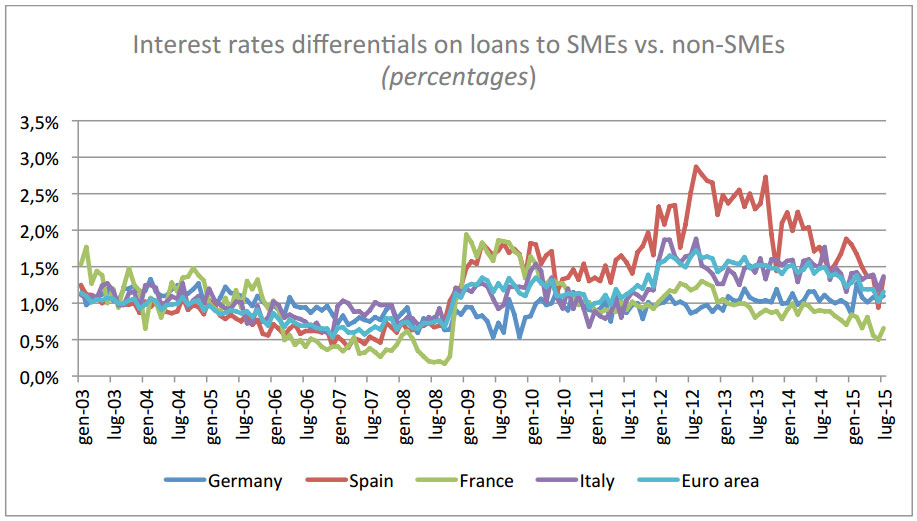
Figure 8
Source: ECB Statistical Data Warehouse. Interest rate differential between new loans to SMEs (up to an including 1 million €) and new loans Non SMEs (loans over 1 million €). The spread is calculated as the difference between the interest rate charged to SMEs and the interest rate charged to large firms
The importance of Small Business Lending for SMEs
Figure 9
Source: BACH Database
Figure 10
Source: BACH Database. Differences between the equity shares of SMEs and non-SMEs.
Figure 11
Source: BACH Database. Data refer to 2103. Other liabilities include: provisions, trade payables, payments received on accounts of orders; current and deferred liabilities.
How cyclical is Small Business Lending?
Figure 12
Source: ECB and European Commission, Survey on the Access to Finance of Enterprises in the Euro area (SAFE). Financing gap is defined as the difference between the perceived need of external financing and the actual availability of funds. Data refer to percentage differences between the number of surveyed firms that have declared that they registered an increase in the financing gap and those that declared a decrease; see Ferrando, A., Griesshaber, S., Köhler-Ulbrich, P., Perez-Duarte, S. and Schmitt, N., “Measuring the opinion of enterprises on the supply and demand of external financing in the euro area”, in Proceedings of the Sixth IFC Conference on “Statistical issues and activities in a changing environment”, Bank for International Settlements, Basel, 28-29 August 2012, IFC Bulletin No 36, February 2013.
Figure 13
Source: ECB and European Commission, Survey on the Access to Finance of Enterprises in the Euro area (SAFE). Percentage change in the number of SMEs reporting a perceived increase in the interest rate charged.
Solvency and riskiness: SMEs vs. large firms
Figure 14
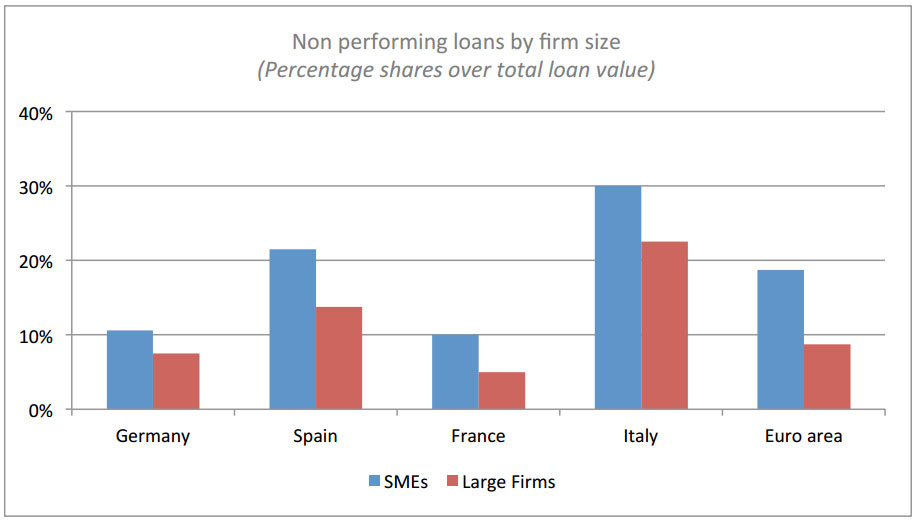
Source: EBA, “Discussion Paper and Call for Evidence on SMEs and SME Supporting Factor”, 2015-02. Data refer to end of 2014.
Figure 15
Source: BACH Database. The coverage ratio is defined as EBITDA over total interest on financial debt.
Figure 16
Source: BACH Database. Profitability is calculated as the ratio of net operating profits to total assets.
Figure 17
Source: BACH Database. The activity ratio is defined as the ratio of net turnover to total assets
Public guarantees
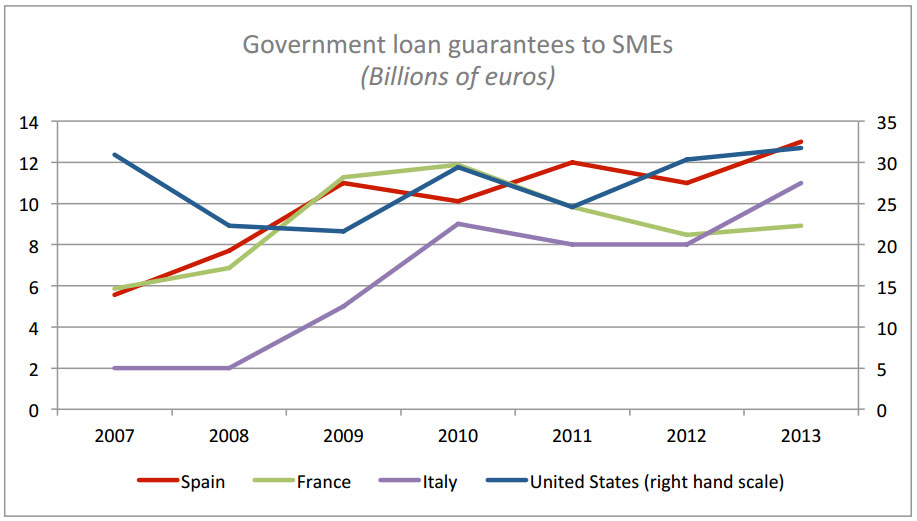
Figure 18
Source: OECD Scoreboard – OCED Report to G20 Finance Ministers and Central Bank Governors, April 2015. According to the OECD definition, through government-guaranteed loans, the “government may provide a revenue or demand guarantee that requires the government to make up the difference if revenue or quantity demanded is below the guaranteed level. Similarly, contracts may also have exchange rate or price guarantees”, and the government has “to repay any amount outstanding amount on a loan in the event of default”. US amounts have been converted into € using the end of year exchange rate.


