Figure 1: MREL is lower for more systemically important banks

Source: EBA QIS data (June 2015). MREL by category for different bank classes.
Figure 2: Three groups of countries emerge within Europe according to the incidence of non-performing loans to total loans

Source: Own elaboration on EBA Risk Dashboard. The ratio measures the share of non-performing loans over total gross loans and advances in June 2016.
Figure 3: The incidence of non-performing loans is different also among the largest EU countries, but it is decreasing everywhere

Source: Own elaboration on EBA Risk Dashboard. The ratio measures the share of non-performing loans over total gross loans and advances in March 2015 and June 2016.
Figure 4: Banks’ Tier1 capital ratio increased in the Euro area and in UK; within country dispersion increased steadily in the Euro area but not in the UK.


Source: Own elaboration on Bankscope (November 2016) data. Tier 1 capital ratio is presented as reported by the bank. Data are expressed as a percentage of risk-weighted assets. The whiskers represent the maximum and the minimum value of the distribution. The box is divided into two parts by the median, i.e. the 50 percent of the distribution. The upper (lower) box represents the 25 percent of the sample greater (lower) than the median, i.e. the upper (lower) quartile. The mean of the distribution is represented by ×.
Figure 5: The ratio of covered deposits over total liabilities is very heterogeneous across Europe, and its level and within country dispersion broadly increased between 2011 and 2015.

Source: Own elaboration on Bankscope (November 2016) data. Covered deposits are estimated for each country according to the level of coverage released by the European Commission’s JCR Report. The sample is composed by banks from France (FR), Germany (DE), Spain (ES), the other Euro area countries, and the United Kingdom (GB). The whiskers represent the maximum and the minimum value of the distribution. The box is divided into two parts by the median, i.e. the 50 percent of the distribution. The upper (lower) box represents the 25 percent of the sample greater (lower) than the median, i.e. the upper (lower) quartile. The mean of the distribution is represented by ×.
Figure 6: The ratio of subordinated debt over total liabilities is very heterogeneous across Europe.
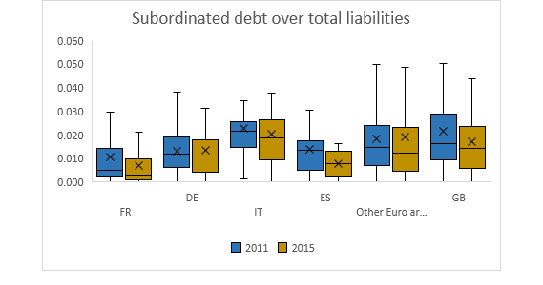
Source: Own elaboration on Bankscope (November 2016) data. The sample is composed by banks from France (FR), Germany (DE), Spain (ES), the other Euro area countries, and the United Kingdom (GB). The whiskers represent the maximum and the minimum value of the distribution. The box is divided into two parts by the median, i.e. the 50 percent of the distribution. The upper (lower) box represents the 25 percent of the sample greater (lower) than the median, i.e. the upper (lower) quartile. The mean of the distribution is represented by ×.
Figure 7: The levels and changes in the ratio of MREL over total liabilities are very heterogeneous across Europe.

Source: Own elaboration on Bankscope (November 2016) data. MREL is calculated according to the EBA Interim Report (2016) as regulatory capital plus total unsecured subordinated debt maturing in more than one year over total assets. The sample is composed by banks from France (FR), Germany (DE), Spain (ES), the other Euro area countries, and the United Kingdom (GB). The whiskers represent the maximum and the minimum value of the distribution. The box is divided into two parts by the median, i.e. the 50 percent of the distribution. The upper (lower) box represents the 25 percent of the sample greater (lower) than the median, i.e. the upper (lower) quartile. The mean of the distribution is represented by ×.
Figure 8: The ratio of loan loss provisions over total assets and its within country dispersion are very heterogeneous across Europe

Source: Own elaboration on Bankscope (November 2016) data. The sample is composed by banks from France (FR), Germany (DE), Spain (ES), the other Euro area countries, and the United Kingdom (GB). The whiskers represent the maximum and the minimum value of the distribution. The box is divided into two parts by the median, i.e. the 50 percent of the distribution. The upper (lower) box represents the 25 percent of the sample greater (lower) than the median, i.e. the upper (lower) quartile. The mean of the distribution is represented by ×