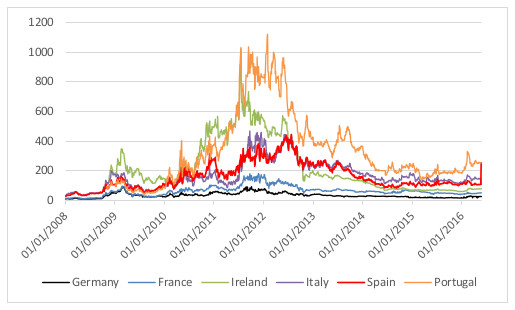
Figure 1: 10-year credit default swaps (CDS) on sovereigns

Source: Thomsom Reuters Datastream. Data are expressed in basis points.
Figure 2: 5-year credit default swaps on banks (percentage points)

Source: Thomsom Reuters Datastream. Data refer to averages of 5-year credit default swaps on banks from each country. Data are expressed in basis points.
Figure 4: Share of domestic sovereign bonds held by MFIs to total assets

Source: ECB. Ratio of the holdings of domestic sovereign debt and total assets by MFIs
in each country. Data are expressed in percentage points.
Figure 5: Share of domestic sovereign bonds held by MFIs to total assets in non-stressed and stressed countries

Source: ECB. Ratio of the holdings of domestic sovereign debt and total assets by MFIs in each country. Data are expressed in percentage points. Non-stressed countries are Austria, Belgium, Finland, France, Germany, and the Netherlands; stressed countries are Greece, Ireland, Italy, Portugal, and Spain.
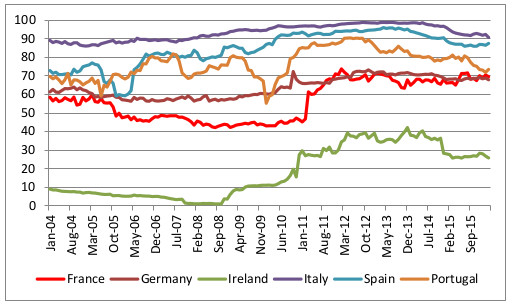
Figure 6: Home bias: Share of domestic sovereign bonds to total sovereign bonds held by MFIs

Source: ECB. Data are expressed in percentage points.

Figure 7: Correlation between loans and sovereign debt holdings of MFIs instressed countries before and after the financial crisis

Source: own elaborations on ECB data. Correlation between monthly ratios of MFIs’ loans to total assets and sovereign debt holdings to total assets. Stressed countries refer to Greece, Ireland, Italy, Portugal, and Spain.
Figure 8: Correlation between loans and sovereign debt holdings of MFIs in non-stressed countries before and after the financial crisis

Source: own elaborations on ECB data. Correlation between monthly ratios of MFIs’ loans to total assets and sovereign debt holdings to total assets. Non-stressed countries refer to Austria, Belgium, Finland, France, Germany, and the Netherlands.